 The average new car buyer in America paid $48,334 in July. That’s $337 – 0.7% — more than June’s total. It’s $199 – 0.4% – more than last July’s price.
Transaction prices sit $1,335 – 2.7% — lower than they did at the start of the year. That total is good for the largest January-to-July tumble in a decade.
“New-vehicle price inflation has all but disappeared in 2023,” said Rebecca Rydzewski, research manager at Kelley Blue Book parent company Cox Automotive. “New-vehicle prices, primarily driven by cuts in luxury and electric vehicles, are decreasing as inventory is steadily improving. With higher inventories and higher incentives helping to keep downward pressure on prices, there certainly are good reasons for shoppers to be heading back into the market.”
Incentives Growing, But Have Room to Grow Much More
Incentives – those discounts dealers and manufacturers advertise to get you in the door – made up 4.4% of the average transaction price (ATP). A year ago, discounts totaled 2.4% of the average buy.
Today’s numbers, however, are still historically low. For comparison, Kelley Blue Book estimates incentives averaged 5.9% of ATP in July 2021 and 10.3% in July 2019.
The high-end luxury car segment had the highest incentives in July 2023 at 9.6% of ATP, followed by luxury cars at 8.4%, hybrid vehicles at 7.7%, entry-level luxury cars at 6.9%, and electric vehicles at 6.7%. Full-size luxury SUVs, high-performance cars, and sports cars had some of the lowest incentives in July.
Non-Luxury Vehicle Prices Dropped
The average non-luxury buyer paid $44,700, which is $471 less than in June. A year ago, non-luxury prices were 0.5% higher.
But the news isn’t all good. Only one car sold for an average price under $20,000 last month. The Mitsubishi Mirage’s average transaction price in July was $19,205.
Every other car with a list price under $20,000 sold for over $20,000 on average. It’s not a large group. Automakers increasingly focus on building more expensive cars, trimming affordable models from their lineups. In December 2017, automakers produced 36 models priced at $25,000 or less. Five years later, they built just 10.
In contrast, there were 32 vehicles in the Kelley Blue Book database transacting on average over $100,000 in July, which excludes super exotics from Ferrari, Lamborghini, Rolls-Royce, and the like. In comparison, five years ago, in the summer of 2018, there were only 12 vehicles in the over $100,000 category.
Mainstream brands with particularly tight inventory – Honda, Kia, and Toyota – raised their incentive spending in July but were still below the industry average.
Luxury Prices Declined, Too – But Americans Are Still Buying A Lot of Luxury Cars
The average luxury vehicle sold for $63,552 last month. That’s almost 3% less than last July. Since the start of the year, luxury prices have declined by more than 5%.
The luxury share of the U.S. market was 19.3% in July, the highest share so far in 2023. Much of the difference comes thanks to Tesla’s popularity. In July, Tesla volume reached a record high of 59,813 units.
EV Prices Down Nearly 20% This Year
Tesla launched a price cut war in the electric vehicle (EV) segment this year, and the numbers show it. In July, the average EV ATP was $53,469, down from $53,682 in June and down from more than $61,000 in January.
Tesla makes up a declining proportion of EV sales, but other automakers have copied its price-cut strategy.
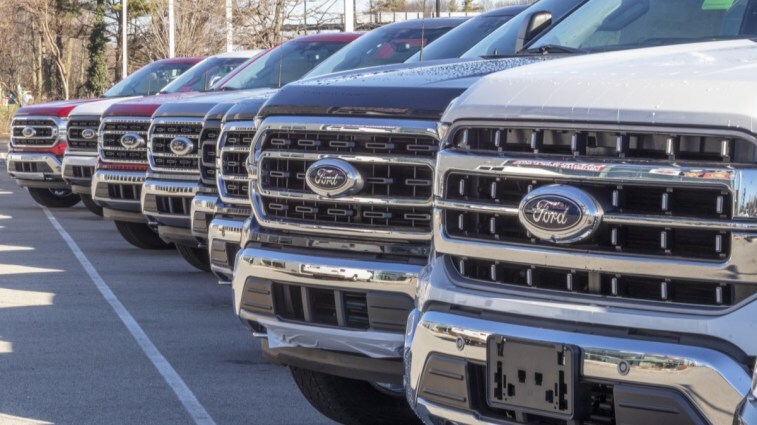
“Tesla prices are down nearly 20% versus a year ago, and other EV models, such as the Ford F-150 Lightning, have been following Tesla’s lead,” says Rydzewski. “While automakers report losing money on electric vehicles, they continue to aggressively pursue EV growth strategies.”
They’re making the cuts, in part, because they have a backlog of unsold EVs. Automakers measure their supply of unsold cars in “days of inventory” – how long it would take dealers to sell out at today’s sales rate if factories shut down.
At the end of July, the EV segment days’ supply was near 100 days, while the industry’s average supply of all cars stood at 54. Cox Automotive days’ supply calculations include vehicles in dealer inventory and in-transit/pipeline units but do not include Tesla.